Features · Coverage physics
Standards-grounded coverage, computed from datasheets.
Wi-Fi propagation, camera optics, and conference A/V each run a deterministic engine over the same building model — with the standard named on every number and the manufacturer's datasheet behind it. Not a cartoon bubble around a dot.
The standards on the page
- ITU-R P.2040 · P.526 · P.1238
- Wi-Fi materials, diffraction, propagation
- IEC 62676-4 (DORI)
- camera pixels-on-target tiers
- AVIXA DISCAS
- display sizing by viewer distance
- IEC 60268-16 (STI)
- speech intelligibility
- NFPA 72
- paging audibility, life safety
- NEC · IEEE 1584
- electrical sizing, arc flash
Named on the deliverable — not buried in a white paper.
Wi-Fi RF
RF that reads the building
Most planning tools pick one propagation philosophy and hope. This engine computes the discrete wall-by-wall losses and the ITU-R P.1238 statistical model, then takes the more conservative answer — so sparse offices and dense warehouses both come out honest.
- Wall materials via ITU-R P.2040 complex permittivity, with TE/TM Fresnel reflection coefficients and image-method first-order reflections.
- Knife-edge and UTD diffraction, plus Deygout multiple-edge diffraction per ITU-R P.526 §4.5.4, with Fresnel-zone clearance — signal bends, and the model knows it.
- Vendor-specific antenna patterns derived from each radio’s datasheet gain and beamwidth instead of an idealized circle, per-zone RF parameters, and warehouse racking attenuation aware of depth, angle, and height.
- Multi-floor attenuation per ITU-R P.1238, and uplink/downlink asymmetry — the phone talks back weaker than the AP talks down.
- Field calibration: feed in measured readings and the engine correlates its predictions against your actual building.
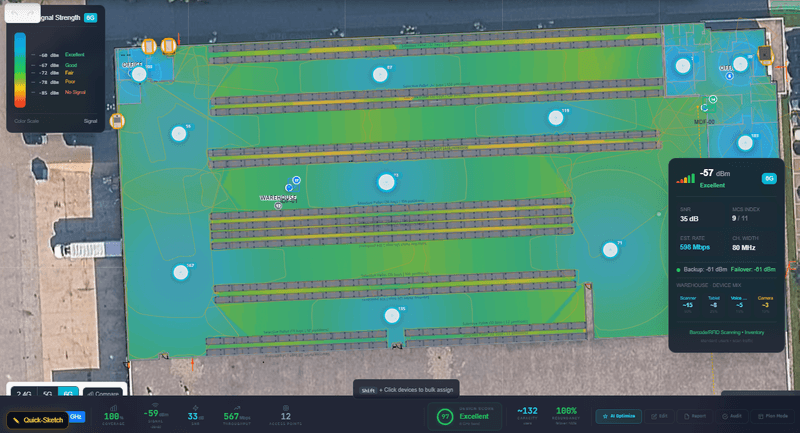
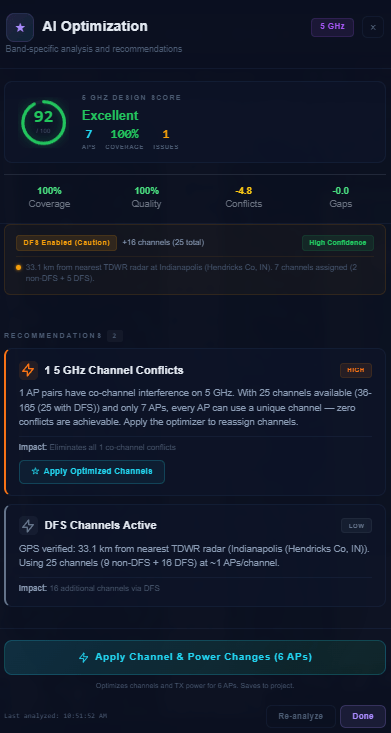
One point on the map
- 01 Wall-by-wall losses every wall, its material, its thickness
- 02 Statistical model ITU-R P.1238 environment exponent
- 03 Take the conservative one honest in offices and warehouses alike
- 04 Bend and reflect UTD + Deygout (P.526) diffraction, Fresnel reflections
- 05 Antenna pattern datasheet-derived vendor pattern, off-axis loss
- 06 Zone overlay per-space noise floor and exponent
One calculation chain feeds the heatmap, placement preview, auto-planner, walkthrough, and remediation.
Camera optics
What the camera sees — not what it points at
A camera cone on a floor plan is a promise. The camera engine renders the promise: pixels-on-target per zone, lens by lens, with the walls, glass, and racking in the way. It is a separate engine from the RF kernel — optics and radio are different physics, and they are treated that way.
- DORI tiers per IEC 62676-4 — detect, observe, recognize, identify — set per zone from what that space is for, and verified against placement.
- Four projection models — rectilinear, fisheye, 180° panoramic, 360° equirectangular — with varifocal fields interpolated from the datasheet's wide and tele endpoints.
- Shadow casting through the obstacle model: walls, glass, and warehouse racking block what they would really block, height-aware.
- IR night vision simulated from the datasheet's rated IR range — see the scene the sensor gets at 2 a.m., not the brochure version.
- A first-person 3D point-of-view per camera with sensor-accurate framing, exported as a POV report your customer can verify on site.
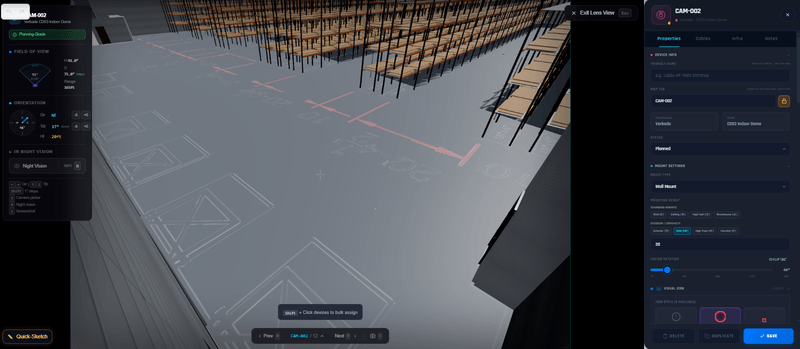
DORI, per IEC 62676-4
- Detect
- 25 px/m — presence of a person or vehicle
- Observe
- 62.5 px/m — characteristic details
- Recognize
- 125 px/m — a person you already know
- Identify
- 250 px/m — an individual, beyond doubt
Zone goals map to tiers; the engine places and verifies to the target.
Conference A/V
Conference rooms, scored seat by seat
Display, audio, microphone, camera — four disciplines meet in one room, and every seat experiences all four. The A/V engine scores each seat and grades the room, before anyone orders a video bar.
- Display sizing per AVIXA DISCAS with off-axis degradation — can the far seat actually read the content?
- Speech intelligibility per IEC 60268-16 STI, from the speaker layout, room acoustics, and per-octave-band reverberation.
- Microphone pickup from real polar patterns — omnidirectional, cardioid, supercardioid, beamforming.
- Camera framing: whether every face is resolved well enough for the far end.
- A composite score per seat, a grade per room, and remediation suggestions with the physics attached.
One seat, four numbers
- Display
- AVIXA DISCAS distance and off-axis
- Audio
- STI per IEC 60268-16
- Microphone
- polar-pattern pickup at the seat
- Camera
- face resolution to the far end
Weighted composite per seat; a grade per room.
The wider kernel
The same model runs four more engines
DAS, paging, sound masking, and electrical run as their own engines on the same obstacle model, orchestrated with cross-domain conflict checks. These cross-domain estimates are design-stage — estimation-grade by design, there to catch conflicts early — and hard life-safety constraints gate every recommendation. Cameras stay a separate engine: different physics, same geometry.
DAS / LTE
Cellular coverage modeled on the same obstacle model — 3GPP-grounded, FCC-aware, on the same zones the Wi-Fi engine reads.
Paging & mass notification
SPL and intelligibility with NFPA 72 audibility in view — life-safety constraints gate recommendations and are never optimized away.
Sound masking
Speech-privacy coverage per the ASTM E1573 / E1130 family, computed on the same zones and openings as everything else.
Electrical
Estimation-grade circuit and load coverage referencing NEC, with IEEE 1584 arc-flash awareness — it flags what needs an engineer; it never replaces one.
Deliverables
Where the numbers land
Physics no one can hand to a customer is trivia. Every engine above feeds deliverables built from the same model.
Coverage heatmaps
Per-band Wi-Fi and per-tier camera heatmaps, in 2D overlays and on the 3D model — with walls, glass, and racking respected.
Per-camera POV reports
What each camera sees, lens by lens, with pixels-on-target — evidence your customer can verify standing on the spot.
Walkthrough reports
A recorded walk through the model with per-band coverage maps and the flagged fixes, ready to hand to a stakeholder.
Site plan sets & BOM
The same model that computes coverage prices itself — sheet sets, schedules, and a bill of materials derived from the design.
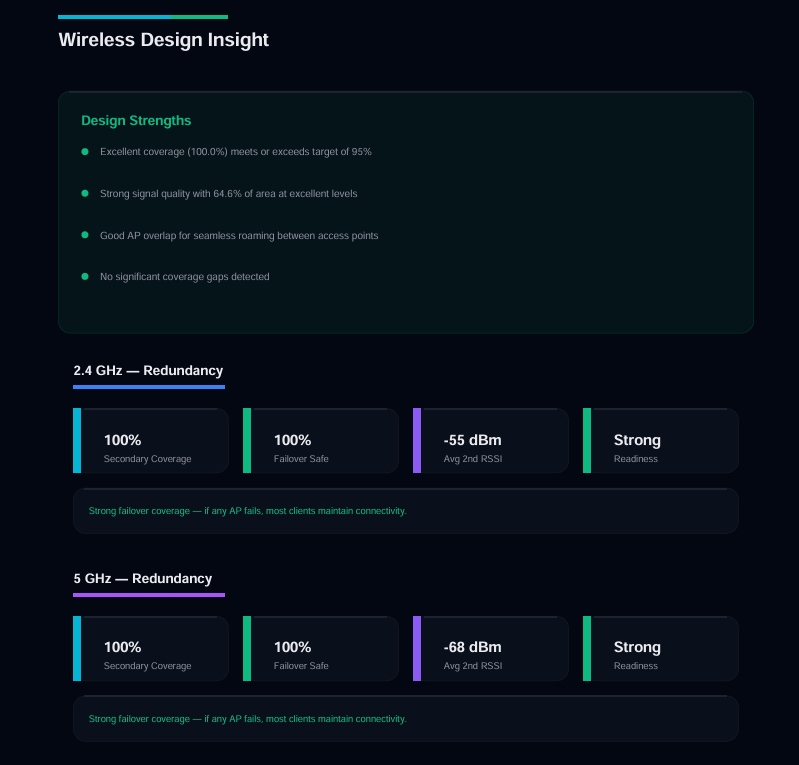
Grounded intelligence
SOC never invents the numbers
Every figure on this page comes from a deterministic engine and a manufacturer datasheet. SOC researches, suggests, and explains — it cannot author a physics number. That boundary is architectural.
Frequently asked questions
How accurate is this compared with a physical survey?
It is design-stage estimation, computed from your obstacle model and manufacturer datasheets, and the platform labels it that way. It exists to find problems before install. A field-calibration workflow lets you correlate predictions against measured readings from your own building — we do not publish accuracy claims we have not measured.
Does the Wi-Fi model handle diffraction and reflections?
Yes. Knife-edge and UTD diffraction, Deygout multiple-edge diffraction per ITU-R P.526 §4.5.4, Fresnel-zone clearance, and image-method first-order reflections with ITU-R P.2040 material permittivity — alongside the hybrid discrete/statistical path-loss selection.
Do warehouse racks really affect coverage?
Heavily — and most tools ignore them. Racking attenuates Wi-Fi with depth, angle of incidence, and height taken into account, and it blocks camera lines of sight as solid structure in the shadow-casting engine.
Is one engine computing all of this?
No — and that is deliberate. Each discipline runs its own deterministic engine — Wi-Fi RF, camera optics, conference A/V, paging, DAS, sound masking, electrical — against the same shared building model. One geometry in; each discipline's own standards-grounded math out.
Who writes these numbers — SOC?
Never. The deterministic engines own every figure; SOC researches products, suggests fixes, and explains results. That boundary is architectural, not editorial.
Put real physics under your next proposal
Bring a floor plan and a device list — we will compute the coverage in front of you. Talk to us about what your team needs.